Archives
Archives
Evaluation of Student’s Perception in the Process of Learning at Nizwa College of Technology
Evaluation of Student’s Perception in the Process of Learning
at Nizwa College of Technology
Dr. Sangeetha Natarajan
Lecturer, Department of Business Studies
Nizwa College of Technology, Sultanate of Oman
Abstract
Learning at college level can help students develop the habit of critical reflection, deepen their understanding of course content, enable them to integrate with practice, sharpen their abilities to solve problems creatively, enhance their skills in working collaboratively, learn about human difference and commonality. In short help students grow both intellectually and personally. The present study evaluates the student’s perception in the process of learning at Nizwa College of Technology, Sultanate of Oman, covering all streams and levels of education offered in the college. The scope of the study is wide as it examines the student’s opinion towards interactive lectures and its effectiveness, student’s interest with respect to internal and external class participation, student’s exam preparation and student’s sensitivity in securing high GPA and their perception on upgrading employability skills and getting placement.
The data for the study was collected from 420 representative samples with the help of structured questionnaire. Likert’s five point scaling technique was used on the basis of which Summary Statistics using Simple Percentage analysis, Mean and Standard deviation were calculated on the total sample. Correlation and Path Coefficient Analysis was applied to find out the most influential factors of perception of students at NCT. Relevant sub samples were grouped on the basis of demographic profiles of the respondents, namely gender, age, level of education, stream of education, working experience if any and comparisons were made to test the association between demographic profiles and perception of students using Chi square and Correlation analysis. Based on the results findings, recommendations and conclusions were presented.
Key words: Learning, Perception, Interactive lectures, GPA, Employability skill
- Introduction:
Learning is the process of acquiring knowledge or information. And is also needed to retain information to use it at future time. The process of learning at college level can help students develop the habit of critical reflection, deepen their understanding of course content, enable them to integrate with practice, sharpen their abilities to solve problems creatively, enhance their skills in working collaboratively, learn about human difference and commonality. In short help students grow both intellectually and personally.
A study conducted by Eyler & Giles (1999) propounded the following observations that supports the significance of learning among college level students:
- A majority of learning students at college level report that they learn more and are motivated to work harder in their regular classes.
- A majority of students report a deeper understanding of subject matter and a recognition of the complexity of social issues.
- Students remember material better through experience and can apply the material that they learn in class to real problems.
- Students report that the power of learning is rooted in personal relationships and in doing work that makes a difference in people's lives.
Thus learning as a process shapes the attitude and behavior of the students.
2. Problem of the study:
Learning process at Nizwa college of Technology delivers high-quality student-centered education that produces competitive graduates who enter the labor market with confidence, strong technological and personal skills, prepared for a life of contribution and success.
The present study is undertaken on the basis of some valid observations on the part of both teachers and students of NCT. Many teachers have observed that students focus on grades rather than learning and that students fail to recognize the value of what they learn. Also, student’s surveys indicate that at times courses being taught are not interesting. Hence there arise the need to shift the focus of education from “teaching” to “learning” methods and environments.
Furthermore, many students, especially those who are new to NCT, do not have a clear understanding of what they learn? How they learn? Or why they learn? All students should understand that interactive lectures are presentations that provide students with multiple brief opportunities for structured engagement. Students should understand that exams are only an official test that shows their knowledge or ability in a particular subject. Although final examination scores are the primary criterion for establishing the validity of student evaluations, the scores reflect only a limited view of student learning outcomes. A single letter grade doesn’t adequately represent the sum total of their personal potential or abilities. More comprehensive indicators of student learning would go beyond the exam score. There are many valid indicators which comes under the purview of student’s learning that includes interest in the subject being taught, critical thinking skills, interpersonal outcomes (e.g. cooperative abilities), intrapersonal outcomes (e.g. self-understanding) and other broad course outcomes.
The above view is supported by Ryan and Harrison (1995), Cashin and Downey (1992, 1999) who examined that student perceptions of learning were highly correlated with their overall ratings of teaching effectiveness and their class participation. The students should understand that class participation are an active engagement process which supports their preparation, contribution to discussion, group skills, communication skills, and attendance. Hence it is of utmost importance that students should perceive that learning changes the behavior either by physical and overt, or it may involve complex intellectual or attitudinal changes which affect behavior in more subtle ways.
3. Research Questions:
Having studied the importance of learning it becomes essential to study the opinion of students towards learning. In reality many questions of doubt arises:
- Whether the students are aware of the significance of learning?
- How he/she perceives learning to be?
- Are they interested in participating inside and outside class activities?
- Are they interested in interactive lectures?
- How does the student’s prepare for their exams?
- Whether the grades awarded reflects the thinking and learning ability of students?
- What is the expected outcome of learning? etc.
These are few questions worthy to be considered. With this perspective of an attempt was made by the researcher to study the student’s perception towards the process of learning at NCT.
4: Objective of the study:
1-Primary objective:
To evaluate students perception in the process of learning at NCT.
2-Secondary objective
1 To study students opinion towards interactive lectures and its effectiveness.
2-To study students interest with respect to internal and external class participation.
3- To study students insight in their exam preparation.
4- To study students sensitivity in obtaining GPA
5-To study students’ perception in upgrading their employability skills.
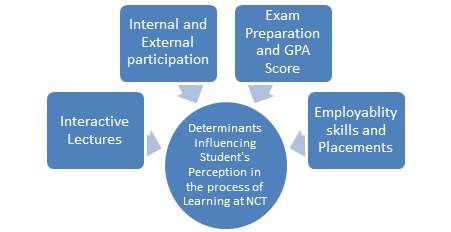
5: Conceptual framework
The present study is influenced by four major determinants and is shown in the following figure:
6: Literature Review:
Over the years, a number of researches were conducted studying different learning styles and its process among students at college level and many theories have emerged. Some of the valid researches in this perspective are presented below:
Blackmore (1996) opined, to aid learning process is to simply be aware that there are diverse learning styles in the student population. There are probably many ways to "teach" as there are to learn. Perhaps the most important thing is to be aware that people do not see the world in the same way. They may have different preferences than the other on how, when, where and how often to learn. Richard M. Felder (2001) in his research titled, ‘Effective Strategies for Cooperative Learning’, studied on forming effective group, dealing with dysfunctional teams, grading; distance learning and how to avoid discouragement among students. According to Woei Hung, Jessica Harpole Bailey and et al.,(2003) in their research titled, “Exploring the Tensions of Problem-Based Learning: Insights from Research”, examined the depth Vs breadth of curriculum, higher-order thinking Vs factual knowledge acquisition, long-term effects Vs immediate learning outcomes, traditional roles of professors Vs the roles of PBL tutors, and students’ initial discomforts Vs their positive attitudes. Michael Prince (2004), in his research entitled, “Does Active Learning Work? A Review of the Research” studied the evidence for the effectiveness of active learning. Prince and Felder (2006) in their research titled ‘Inductive Teaching and Learning Methods: Definitions, Comparisons and Research Bases ‘, examined inductive teaching methods including inquiry learning, problem-based learning, project-based learning, case-based teaching, discovery learning and just-in-time teaching, highlighting commonalities and specific differences, and reviewing research on the effectiveness of each methods. Lisa G. Bullard and Richard M. Felder (2007) in their research titled, “A Student-Centered Approach to Teaching Material and Energy Balances”, examined the preparation of handouts and active learning, cooperative learning by doing assignment, team formation, individual accountability and technology.
Richard M. Felder and Rebecca Brent (2007) in their research titled, “Cooperative Learning” opined, Cooperative learning should satisfy five criteria: (1) positive interdependence, (2) individual accountability, (3) face-to face interaction for at least part of the work, (4) appropriate use of interpersonal skills, and (5) regular self-assessment of team functioning. Ellen E. Ballock (2007) in his research on the development and evaluation of a self-study process for critical friends groups explored the development and evaluation of a self -study framework and process, analyzed the development of their community, collaborative work, and learning. Lisa Bullard, Richard Felder and et al., (2008) studied the effects of active learning on student performance and retention in Chemical Engineering. Kelly A. Rocca(2010) , in her research titled, “Student Participation in the College Classroom: An Extended Multidisciplinary Literature Review” , tried to integrate previous research and studied; student participation in the college classroom, logistical issues, student confidence, personality traits, instructor’s influence, the role of sex in participation, and participation in web-based courses.
According to Hacettepe University, (2011) in their research titled, “College of Education Students’ Approaches to Learning and Study Skills” investigated the difference in students’ approaches to learning. Southern Arkansas University Tech (2012-13) conducted research on “Institutional Self-Study Computer Information Technology Program”, with the objective of describing specific educational goals, objectives and activities of the program, Explaining how the program serves the general education program and other disciplinary programs on the campus. Chris Park (2013), conducted a research on Engaging Students in the Learning Process. Tanveer Iqbal, Mumtaz Akhtar and et al (2014) , in their research titled, “ Relationship of students approaches to studying and teachers approaches to teaching at graduate level in Punjab”, examined how students acquire critical thinking and problem solving skills, described different approaches employed by the teachers in higher education and reveal the degree to which information transmission / teacher-focused (ITTF) approach is linked with a surface approach to studying .This confirms the previous studies by Trigwell, Prosser and Waterhouse (1997), Ramsden (1992), Richardson (2005). Good teaching is one of the factors, as identified by Ramsden that leads to deeper approach to learning. Georgia L. Bauman (2016) in his research titled, “Promoting Organizational Learning in Higher Education to Achieve Equity in Educational Outcomes”, studied the ways of promoting organizational learning among faculty, staff and administrators. In his study he disagreed with Garvin’s view (1993) that higher education institutions do not engage in learning.
All the above listed research studies provide a holistic view of learning styles among students at college level. Across the broad landscape of learning styles and process, it is possible to draw some broad conclusions:
- Most learning style theories focus on the ability to think
- Few approaches address the role of feelings and emotions in learning
- Few researches deal with the role of physical activity in learning
- Effective learning occurs when it is conducted interactive.
7: Methodology of the Study:
The Research design for the present study is Analytical in nature, as the data and facts pertaining to the study were collected, compiled, evaluated and the sources were used to prove the framed hypothesis and support the defined objectives. The present study comprises of all the students studying at NCT, hence it is limited and it is 4655 in number (N= 4655). The sample size of the present study is fixed as 460 in number and the distribution of the sample size comprising the students in different education streams at Nizwa College of Technology is presented below.
Multistage Sampling is adopted in the present research whereby the population is segmented as per departments at NCT namely English Language centre (ELC), Information Technology (IT), Business Studies Department (BSD) and Engineering (ENG). In order to get a representative sample from each stratum the samples are selected proportionately say 27%, 12%, 21% and 40 % respectively. Thereby Stratified and Quota Sampling was adopted in the first and second stage followed by Convenience sampling in the third stage.
The table presents in detail the total number of students, the proportion and the number of samples from different streams of education. Hence the sample frame is representative of the total population. The present research used both primary and secondary data. Primary data was collected from structured questionnaire and the secondary data from books, reports from college and internet. The said questionnaire includes the profile of the respondents (gender, age, level of education, department and working experience of the respondents) and the questions that assess the defined objectives.
Table No: 7.1
Table showing the distribution of sampling frame
|
Departments at NCT |
No. of students |
Percentage |
Sample size |
|
English Language Centre (ELC) |
1263 |
27 |
124 |
|
Information Technology (IT) |
554 |
12 |
55 |
|
Business Studies Department (BSD) |
991 |
21 |
97 |
|
Engineering(ENG) |
1847 |
40 |
184 |
|
TOTAL |
N=4655 |
100 |
n = 460 |
This part contains thirty six relevant questions based on the defined objectives. Likert’s five point scaling technique was adopted in the construction of the questions ranging from least favorable to the most favorable responses. (Strongly disagree / Disagree/ Neutral/ Agree/ Strongly Agree). Out the total number of questionnaires (460) distributed to the students in various departments, from ELC only 106 responses were considered valid. So as from IT, BSD, ENG departments it was 56, 97 and 160 respectively. So the total number of valid responses accounted to 420 in number (n=420). This accounts to the response rate of 10% of the total population.
The collected data was processed with suitable statistical tools and techniques and results were drawn out. Determinants influencing the perception of students’ learning process was tested for their reliability using Cronbach’s Alpha test were the respective scores are greater than seven. Hence the validity of the determinants was proved. Likert’s Five point scaling technique was used on the basis of which Summary Statistics using Simple Percentage analysis, Mean and Standard deviation were calculated on the total sample. Correlation and Path Coefficient Analysis was applied to find out the most influential factors of perception of students at NCT. Relevant sub samples were grouped on the basis of demographic profiles of the respondents, namely gender, age, level of education, stream of education, working experience if any and comparisons were made to test the association between demographic profiles and perception of students using Chi square and Correlation analysis.
8: Analysis and its implication:
8.1 Testing the factors influencing the perception of students’ learning process:
Interactive lectures, preparation of exams and securing GPA, internal and external participation of the students’, employability skills and placements plays an important role in influencing the perception of learning process of students. Hence various factors influencing the learning process was analyzed and thereby their perception was studied. To do so, students were asked to state their agreement and disagreement on five-point Likert’s scale ranging from the most unfavorable responses to most favorable responses on a set of statements related to different aspects of perception and learning process. The results are shown in Table No: 8.1.
Table No 8.1
Table showing the factors influencing the perception of students’ learning process
|
Determinants |
SA |
|
A |
N |
DA |
SDA |
Mean |
Std. Deviation |
Total N |
|
Interactive lectures improves creativity |
88 |
|
150 |
60 |
74 |
48 |
3.37 |
1.302 |
420 |
|
Interactive lectures develop understanding |
90 |
|
164 |
80 |
54 |
32 |
4.54 |
1.181 |
420 |
|
Interactive lectures helps in better retention of knowledge |
74 |
|
158 |
108 |
52 |
28 |
3.47 |
1.119 |
420 |
|
Active and participative teaching /learning prepares me to take greater responsibilities |
84 |
|
172 |
88 |
46 |
30 |
4.56 |
1.139 |
420 |
|
Lack of resources and facilities at college affect my learning |
96 |
|
126 |
94 |
64 |
40 |
3.41 |
1.257 |
420 |
|
I believe quality of teaching has greater impact on my performance upgradation |
108 |
|
126 |
100 |
68 |
18 |
4.57 |
1.159 |
420 |
|
At times I feel courses are not interesting |
106 |
|
100 |
110 |
58 |
46 |
3.39 |
1.296 |
420 |
|
I like to participate in class activities assigned to me |
58 |
|
144 |
92 |
78 |
48 |
3.20 |
1.225 |
420 |
|
I like to share my ideas/information on the topic discussed in the class |
86 |
|
142 |
96 |
64 |
32 |
3.44 |
1.192 |
420 |
|
I attend classes for the sake of attendance only |
50 |
|
88 |
98 |
94 |
90 |
2.80 |
1.315 |
420 |
|
I seek the help of the teacher in case of my absence in the class for better understanding. |
42 |
|
142 |
134 |
52 |
50 |
3.18 |
1.145 |
420 |
|
I am confined if I understood with what is given in handout |
82 |
|
116 |
118 |
52 |
52 |
3.30 |
1.262 |
420 |
|
I am using all resources like library/internet etc. to understand more about courses being taught |
58 |
|
102 |
104 |
86 |
70 |
2.98 |
1.292 |
420 |
|
I help my friend/s in case of his/her difficulty in understanding the courses being taught. |
162 |
116 |
78 |
48 |
16 |
3.86 |
1.164 |
420 |
|
|
I am interested in participating competitions inside/ outside the college |
64 |
|
126 |
104 |
70 |
56 |
3.17 |
1.259 |
420 |
|
I wish to participate in seminars/ conferences/workshops conducted inside or outside college. |
66 |
|
106 |
104 |
92 |
52 |
4.10 |
1.261 |
420 |
|
I make use of all the training programs assigned to me |
87 |
|
118 |
106 |
64 |
45 |
3.33 |
1.259 |
420 |
|
I prefer to work in teams in the projects assigned. |
72 |
|
118 |
115 |
72 |
43 |
3.25 |
1.221 |
420 |
|
I try to change or improve my behavior if I receive a bad comment in the phase of learning. |
103 |
|
112 |
105 |
59 |
41 |
3.42 |
1.267 |
420 |
|
I work more for my team even if other members do not work |
100 |
|
128 |
100 |
57 |
35 |
3.48 |
1.225 |
420 |
|
I like to be the best performer in all the works assigned to me rather than merely completing the said task. |
96 |
|
140 |
90 |
65 |
29 |
3.50 |
1.198 |
420 |
|
I solely depend on the handouts for my exam preparation |
86 |
|
119 |
105 |
73 |
37 |
3.34 |
1.231 |
420 |
|
For me exams are for securing marks and not for testing knowledge |
69 |
|
108 |
109 |
79 |
55 |
3.14 |
1.269 |
420 |
|
I can manage writing surprise test / quizzes easily |
60 |
|
114 |
108 |
67 |
71 |
3.06 |
1.296 |
420 |
|
I believe I will get better marks if I write exactly the same wordings in handout in exams. |
56 |
|
114 |
110 |
70 |
70 |
3.04 |
1.281 |
420 |
|
I am interested in knowing the right answers after the exams and have discussion with the teacher |
64 |
|
118 |
111 |
75 |
52 |
3.16 |
1.242 |
420 |
|
I demand for marks with the teacher even if answers are not correct |
58 |
|
115 |
115 |
77 |
55 |
3.10 |
1.235 |
420 |
|
I am satisfied with the marks I get in exams rather than what I learned in the course |
44 |
|
110 |
128 |
88 |
50 |
3.02 |
1.170 |
420 |
|
I believe knowledge is judged on the basis of GPA |
38 |
|
118 |
138 |
92 |
34 |
3.08 |
1.087 |
420 |
|
I basically learn to get high GPA |
54 |
|
108 |
133 |
82 |
43 |
3.11 |
1.169 |
420 |
|
I am convinced with the marks awarded by the teacher, even if her/his level of teaching is not satisfactory. |
60 |
|
107 |
133 |
70 |
50 |
3.14 |
1.206 |
420 |
|
I will memorizes the subject in case if the teachers fails to make it clear |
58 |
|
120 |
133 |
64 |
45 |
3.20 |
1.177 |
420 |
|
I complain to the concerned authority in case if the teaching is not good |
58 |
|
130 |
120 |
71 |
41 |
3.22 |
1.173 |
420 |
|
My learning at NCT improves my employability skills |
55 |
|
130 |
122 |
68 |
45 |
4.20 |
1.179 |
420 |
|
I am more concerned in securing higher GPA than upgrading my employability skills |
53 |
|
123 |
130 |
65 |
49 |
3.16 |
1.182 |
420 |
|
I believe high GPA will help me in better placements |
85 |
|
120 |
101 |
66 |
48 |
4.30 |
1.273 |
420 |
The above table depicts the students belief on Interactive lectures and the level of understanding (4.54), participative teaching /learning in assuming greater responsibilities(4.56), quality of teaching and performance upgradation (4.57), internal and external participation on seminars, conferences, workshops (4.10), learning and improvement in employability skills(4.2), GPA score and securing better placements(4.30). In all the above mentioned statements their mean values are greater than the average mean value (3), hence it is considered favorable response under Likert’s Scaling Technique. In case of other factors, the mean value is almost equal to the average mean score which shows a neutral response. Usage of resources like library and internet (2.9) and attending classes for the sake of attendance (2.8) shows an unfavorable responses by the students.
8.2 Test to find the most influential factors of perception of the students towards learning process:
In testing the relationship of influencing factors the following null hypothesis were formulated and were duly tested using Correlation and Path Coefficient Analysis.
Null Hypothesis: HO
- Interactive lectures does not influences the perception of the students’ learning process at NCT.
- Internal and External class participation does not influences the perception of the students’ learning process at NCT.
- Exam preparation; student’s sensitivity in obtaining GPA does not influences the perception of the students’ learning process at NCT.
- Upgradation of employability skills does not influences the perception of the students’ learning process at NCT.
Following relationship was considered in this case:
Y = f ( x1, x2, x3, x4)
Where Y = perception of students’ learning process at NCT
X1 = Interactive lectures
X2 = Internal and external participation oF students
X3 = Exam preparation; student’s sensitivity in obtaining GPA
X4 = upgradation of employability skills
The inter-correlation matrix of explanatory variables namely X1, X2, X3, X4 with dependent variable Y is furnished in the following table no. 8.2
TABLE No: 8.2 INTER-CORRELATION MATRIX
|
|
X1 |
X2 |
X3 |
X4 |
Y |
|
X1 |
1.000 |
|
|
|
|
|
X2 |
0.944** |
1.000 |
|
|
|
|
X3 |
0.955** |
0.952** |
1.000 |
|
|
|
X4 |
0.812** |
0.813** |
0.884** |
1.000 |
|
|
y |
0.690** |
0.639** |
0.797** |
0.942** |
1.000 |
** Significant at one percent level
It is seen from the above table the correlation between all the explanatory variables are significant at one percent level and was positive. Further it is seen that all these explanatory variables are, significantly and positively correlated with the dependent variable connected. This indicates strong relationship between Interactive lectures, Internal and external participation, Exam preparation; student’s sensitivity in obtaining GPA, upgradation of employability skills with perception of students’ learning process at NCT.
Path Coefficient Analysis:
The direct effect of each explanatory variables on the dependent variable and the indirect effect of each explanatory variables on the dependent variable was explained by path coefficient analysis and the results were furnished in the table no: 8.3. It was seen from the above table that among the Four explanatory variables namely X1, X2, X3, X4 all the variables have higher positive direct effect on the dependent variable Y.
TABLE No: 8.3
Table showing the Direct & Indirect Effect of Explanatory Variables
|
|
X1(Interactive lectures) |
X2 (Internal and external participation) |
X3 (Exam preparation and Securing GPA) |
X4(Employability skills) |
Y(Perception of students learning process at NCT ) |
|
X1 |
0.187 |
-0.573 |
0.348 |
0.570 |
0.690** |
|
X2 |
0.176 |
-0.607 |
0.307 |
0.570 |
0.639** |
|
X3 |
0.378 |
-0.578 |
0.124 |
0.620 |
0.797** |
|
X4 |
0.152 |
0.823 |
0.114 |
0.701 |
0.942** |
The variable X1 also has a higher positive indirect effect on Y through X3(Exam preparation and Securing GPA). Similarly the variable X2 also had positive indirect effect on the dependent variable Y through X4(Employability skills). The variable X3 also had higher positive indirect effect on the dependent variable Y through X1(Interactive lectures) and x2(Internal and external participation). Hence all the variables were substantially important as they contributes to variable Y (Perception of students learning process at NCT).
8.3 (a) Testing the association between the student’s perceptions towards interactive lectures and the demographic profile:
Interactive lectures are presentations that provide students with multiple opportunities for structured engagement in an activity and let them work directly with the material which allows students to apply what they have learned. The table depicts the students’ perception towards interactive lectures in the learning process. It shows that majority of the students between the age group of 21 to 25 (202) agreed that interactive lectures develops their level of understanding. The students in the higher level of education say diploma second year (100) to Bachelorate level (106) has given a positive reply. Majority of the female students (248) studying in ELC (106) and Engineering (160) with no working experience agreed to the said factor. It was empirically tested with the formulation of the hypothesis if the demographic profiles of students have an association with their perception on interactive teaching learning process.
HO- There is no association between Age/Gender/ Working experience/ Stream of education /Level of Education of the students and their perception on interactive teaching learning process
Ha- There is association between the Age/Gender/Working experience/ Stream of education /Level of Education of the students and their perception on interactive teaching learning process
Table No: 8.4
|
Particulars |
Interactive lectures develops level of understanding |
Total |
Chi Square value |
df |
p value ( 0.01 level of significance) |
||||||
|
SDA |
DA |
N |
A |
SA |
|||||||
|
Age |
15-20 |
O |
32 |
54 |
80 |
42 |
0 |
208 |
320.13 |
16 |
0.00001 Significant |
|
E |
15.8 |
26.7 |
39.6 |
81.2 |
44.6 |
208.0 |
|||||
|
21-25 |
O |
0 |
0 |
0 |
122 |
80 |
202 |
||||
|
E |
15.4 |
26.0 |
38.5 |
78.9 |
43.3 |
202.0 |
|||||
|
26-30 |
O |
0 |
0 |
0 |
0 |
6 |
6 |
||||
|
E |
.5 |
.8 |
1.1 |
2.3 |
1.3 |
6.0 |
|||||
|
31-35 |
O |
0 |
0 |
0 |
0 |
2 |
2 |
||||
|
E |
.2 |
.3 |
.4 |
.8 |
.4 |
2.0 |
|||||
|
36-40 |
O |
0 |
0 |
0 |
0 |
2 |
2 |
||||
|
E |
.2 |
.3 |
.4 |
.8 |
.4 |
2.0 |
|||||
|
Total |
O |
32 |
54 |
80 |
164 |
90 |
420 |
||||
|
E |
32.0 |
54.0 |
80.0 |
164.0 |
90.0 |
420.0 |
|||||
|
Level of Education |
Foundation |
O |
32 |
54 |
20 |
0 |
0 |
106 |
954.77 |
16 |
0.00001 Significant |
|
E |
8.1 |
13.6 |
20.2 |
41.4 |
22.7 |
106.0 |
|||||
|
Diploma year one |
O |
0 |
0 |
60 |
6 |
0 |
66 |
||||
|
E |
5.0 |
8.5 |
12.6 |
25.8 |
14.1 |
66.0 |
|||||
|
Diploma year 2 |
O |
0 |
0 |
0 |
100 |
0 |
100 |
||||
|
E |
7.6 |
12.9 |
19.0 |
39.0 |
21.4 |
100.0 |
|||||
|
Advanced diploma |
O |
0 |
0 |
0 |
42 |
0 |
42 |
||||
|
E |
3.2 |
5.4 |
8.0 |
16.4 |
9.0 |
42.0 |
|||||
|
Bachelorate |
O |
0 |
0 |
0 |
16 |
90 |
106 |
||||
|
E |
8.1 |
13.6 |
20.2 |
41.4 |
22.7 |
106.0 |
|||||
|
Total |
O |
32 |
54 |
80 |
164 |
90 |
420 |
||||
|
E |
32.0 |
54.0 |
80.0 |
164.0 |
90.0 |
420.0 |
|||||
|
Stream of Education |
Business |
O |
32 |
54 |
12 |
0 |
0 |
98 |
680.95 |
12 |
0.00001 Significant |
|
E |
7.5 |
12.6 |
18.7 |
38.3 |
21.0 |
98.0 |
|||||
|
Engineering |
O |
0 |
0 |
68 |
92 |
0 |
160 |
||||
|
E |
12.2 |
20.6 |
30.5 |
62.5 |
34.3 |
160.0 |
|||||
|
ELC |
O |
0 |
0 |
0 |
72 |
34 |
106 |
||||
|
E |
8.1 |
13.6 |
20.2 |
41.4 |
22.7 |
106.0 |
|||||
|
IT |
O |
0 |
0 |
0 |
0 |
56 |
56 |
||||
|
E |
4.3 |
7.2 |
10.7 |
21.9 |
12.0 |
56.0 |
|||||
|
Total |
O |
32 |
54 |
80 |
164 |
90 |
420 |
||||
|
E |
32.0 |
54.0 |
80.0 |
164.0 |
90.0 |
420.0 |
|||||
|
Experience |
Nil |
O |
32 |
54 |
80 |
164 |
80 |
410 |
37.561 |
16 |
0.00001 Significant |
|
E |
31.2 |
52.7 |
78.1 |
160.1 |
87.9 |
410.0 |
|||||
|
1-5 yrs |
O |
0 |
0 |
0 |
0 |
4 |
4 |
||||
|
E |
.3 |
.5 |
.8 |
1.6 |
.9 |
4.0 |
|||||
|
6-10 yrs |
O |
0 |
0 |
0 |
0 |
2 |
2 |
||||
|
E |
.2 |
.3 |
.4 |
.8 |
.4 |
2.0 |
|||||
|
11-15 yrs |
O |
0 |
0 |
0 |
0 |
2 |
2 |
||||
|
E |
.2 |
.3 |
.4 |
.8 |
.4 |
2.0 |
|||||
|
16-20 yrs |
O |
0 |
0 |
0 |
0 |
2 |
2 |
||||
|
E |
.2 |
.3 |
.4 |
.8 |
.4 |
2.0 |
|||||
|
Total |
O |
32 |
54 |
80 |
164 |
90 |
420 |
||||
|
E |
32.0 |
54.0 |
80.0 |
164.0 |
90.0 |
420.0 |
|||||
|
Gender |
Male |
O |
32 |
54 |
80 |
6 |
0 |
172 |
396.09 |
4 |
0.00001 Significant |
|
E |
13.1 |
22.1 |
32.8 |
67.2 |
36.9 |
172.0 |
|||||
|
Female |
O |
0 |
0 |
0 |
158 |
90 |
248 |
||||
|
E |
18.9 |
31.9 |
47.2 |
96.8 |
53.1 |
248.0 |
|||||
|
Total |
O |
32 |
54 |
80 |
164 |
90 |
420 |
||||
|
E |
32.0 |
54.0 |
80.0 |
164.0 |
90.0 |
420.0 |
|||||
**O- Observed Frequency , E- Expected Frequency
The results depicted in the Table no. 8.4 shows that there is an association with the student’s perception on interactive teaching learning process and their demographic profile; say age ( χ2 = 320.13 > p value :0.00001) , Level of education ( χ2 = 954.77 > p value :0.00001), Department ( χ2 = 680.95 > p value :0.00001), Gender ( χ2 = 396.09 > p value : 0. 002125 ) and Experience ( χ2 = 37.561 > p value : 0.08119 ) as the calculated chi square value is greater than the p value at 1 percent level of significance . This disproves the Null hypothesis.
8.3 (b) Testing the association between the student’s perception towards improving employability skills and the demographic profile:
Employability skills are general skills that are necessary for success in the labor market at all employment levels and in all sectors. These skills have a number of names soft skills, workforce readiness skills, career readiness skills but they all speak to the same set of core skills that employers want. The table 8.5 depicts, majority of the female students (248) with nil working experience (410) agreed that learning process at NCT improves the employability skills. The students in the higher level of education say Diploma second year (100) to Bachelorate (106) with ELC (106) and Engineering (160) as their stream of education has given a positive reply. It was empirically tested with the formulation of the hypothesis whether the demographic profile of the students’ have an association with the student’s perception on learning process in developing employability skills.
Table No: 8.5
|
Particulars |
Learning at NCT improves employability skills |
Total |
Chi Square value |
df |
p value ( 0.01 level of significance |
|||||
|
SDA |
DA |
N |
A |
SA |
||||||
|
Level of education |
Foundation |
45 |
60 |
1 |
0 |
0 |
106 |
|||
|
Diploma year 1 |
0 |
8 |
58 |
0 |
0 |
66 |
393.18 |
16 |
0.00001 Significant |
|
|
Diploma year 2 |
0 |
0 |
63 |
37 |
0 |
100 |
||||
|
Advanced diploma |
0 |
0 |
0 |
42 |
0 |
42 |
||||
|
Bachelorate |
0 |
0 |
0 |
51 |
55 |
106 |
||||
|
Total |
45 |
68 |
122 |
130 |
55 |
420 |
||||
|
Stream of Education |
Business |
45 |
53 |
0 |
0 |
0 |
98 |
1003 |
12 |
0.00001 Significant |
|
Engineering |
0 |
15 |
122 |
23 |
0 |
160 |
||||
|
ELC |
0 |
0 |
0 |
104 |
2 |
106 |
||||
|
IT |
0 |
0 |
0 |
3 |
53 |
56 |
||||
|
Total |
45 |
68 |
122 |
130 |
55 |
420 |
||||
|
Working experience |
Nil |
45 |
68 |
122 |
130 |
45 |
410 |
67.998 |
16 |
0.00001 Significant |
|
1-5 years |
0 |
0 |
0 |
0 |
4 |
4 |
||||
|
6-10 yrs |
0 |
0 |
0 |
0 |
2 |
2 |
||||
|
11-15 yrs |
0 |
0 |
0 |
0 |
2 |
2 |
||||
|
16-20 yrs |
0 |
0 |
0 |
0 |
2 |
2 |
||||
|
Total |
45 |
68 |
122 |
130 |
55 |
420 |
||||
|
Gender |
male |
45 |
68 |
59 |
0 |
0 |
172 |
294 |
4 |
0.00001 Significant |
|
female |
0 |
0 |
63 |
130 |
55 |
248 |
||||
|
Total |
45 |
68 |
122 |
130 |
55 |
420 |
||||
HO- There is no association between the Gender / Working experience/ Stream of Education /Level of Education of the students and their perception on teaching learning process in improving employability skills.
Ha- There is association between the gender/ Working experience/ Stream of education /Level of Education of the students and their perception on teaching learning process in improving employability skills.
The results depicted in the Table no. 8.5 shows that there is association among the said factors say Level of education ( χ2 = 393.18 > p value :0.00001), stream of education ( χ2 = 1003> p value :0.00001), Gender ( χ2 = 294> p value : 0. 002125 ) and Working experience ( χ2 = 67.998> p value : 0.08119 ) as the chi square value is greater than the p value at 1 percent level of significance. This disproves the Null hypothesis.
8.3. Testing the association between the student’s perception towards securing GPA with the demographic profile
A Grade Point Average is a number representing the average value of the accumulated final grades earned in courses over time. A student’s grade point average is calculated by adding up all accumulated final grades and dividing that figure by the number of grades awarded.The results shows that on testing 420 respondents the calculated value (p=.000) is less than the table value(r = 0.05). Hence the alternative hypothesis is proved which states that there is association between age /experience / level of education / department and Student’s perception on securing GPA.
HO: There is no association between age/Working experience / level of education / stream of education with Student’s perception on securing GPA.
Ha: There is association between age/working experience / level of education / stream of education with Student’s perception on securing GPA.
Table No. 8.6
|
|
Experience
|
Age
|
Department
|
Level of education |
Perception on GPA |
|
Experience |
1 |
.562** |
.244** |
.188** |
.211** |
|
Age |
.562** |
1 |
.755** |
.784** |
.752** |
|
Department |
.244** |
.755** |
1 |
.928** |
.939** |
|
Level of education |
.188** |
.784** |
.928** |
1 |
.911** |
|
Student’s perception on GPA |
.211** |
.752** |
.939** |
.911** |
1 |
|
**. Correlation is significant at the 0.01 level (2-tailed).
|
|||||
8.3(d)Testing the association between the student’s perception towards participation in class activities with the demographic profile:
Participation also has been defined as ‘‘the number of unsolicited responses volunteered’’. Participation can be seen as an active engagement process which can be sorted into five categories: preparation, contribution to discussion, group skills, communication skills, and attendance. The results shows that on testing 420 respondents the calculated value (p=.000) is less than the table value(r = 0.05). Hence it is proved that there is association between age /experience / level of education / department and student’s perception on participation in class activities.
HO: There is no association between age and working experience / level of education / stream of education and student’s perception on participation in class activities.
Ha: There is association between age /working experience / level of education / stream of education and student’s perception on participation in class activities.
|
|
Experience |
Age |
Department |
Level of education |
participation in class activities |
|
Experience |
1 |
.562** |
.244** |
.188** |
-.248** |
|
Age |
.562** |
1 |
.755** |
.784** |
-.817** |
|
Department |
.244** |
.755** |
1 |
.928** |
-.922** |
|
Level of education |
.188** |
.784** |
.928** |
1 |
-.926** |
|
Participation in class activities |
-.248** |
-.817** |
-.922** |
-.926** |
1 |
|
**. Correlation is significant at the 0.01 level (2-tailed). |
|||||
Table No: 4.45
On testing the association between independent variables say; Age, Experience, Department and
Level of education with dependent variables say:
i) Students perception on employability skills,
ii) Students’ participation in class activities
iii) Students perception on Interactive lectures and level of understanding
iv) Perception on GPA, it was found out that all the above said variable are highly correlated.
Conclusions and Recommendations:
The process of learning at college level can help students develop the habit of critical reflection, deepen their understanding of course content, enable them to integrate with practice, sharpen their abilities to solve problems creatively, enhance their skills in working collaboratively, learn about human difference and commonality and in short help students grow both intellectually and personally. In this regard the present study is conducted to study the students’ opinion on interactive lectures and its effectiveness, internal and external class participation, student’s insight in exam preparation; student’s sensitivity in obtaining GPA and their perception in upgrading employability skills. Data was collected and was duly analysed with suitable tools and techniques, thereby the most influential determinant was identified. On the basis of the results the researcher propounds the following recommendations:
1- Seminars, Conferences and Workshops can be arranged periodically to enrich knowledge, personality and employability skills of the students. This could be implemented on the basis of the level of education and the stream of education they undergo.
2- Career guidance and counselling can be a part of the curriculum to orient students, the necessity of learning, personal development, improving employability skills and getting placements. This would help the students to change their purview of learning from merely securing marks to upgrading their employability skills.
3- Improvement or upgradation in the course content can be done to make it more interesting by adding more practical activities and field work projects which invokes the application of theories into practice.
4- College can think of adding resources and facilities like; installing more computers in the library to manage the student crowd, improving internet connectivity and its speed limit, offering separate places for male and female students to prepare for the courses, accessibility of photocopying machines etc, to enable and support the students in their phase of learning. In addition students should be persuaded to make maximum possible use of resources like library, internet etc to understand the course content better.
References:
- Blackmore, J. (1996). Pedagogy: Learning styles [Online].
- Blackmore, J. (1996). Pedagogy: Learning styles [Online]. Available http://granite.cyg.net/~jblackmo/diglib/styl-a.html[1997, September 10]
- Cashin, W. E., & Downey, R. G. (1992). Using global student rating items for summative evaluation. Journal of Educational Psychology, 84(4), 563-572.
- Cashin, W. E., & Downey, R. G. (1999, April). Using global student rating items for summative evaluation: Convergence with a second criterion. Paper presented at the annual meeting of the American Educational Research Association, Montreal, Quebec, Canada.
- David A. Garvin, (1993) Building a Learning Organization, ARTICLE | HARVARD BUSINESS REVIEW | JULY–AUGUST
- Ellen Ballock (2007) Developing a Process for Purposefully Examining and Improving CFG Work, Presented at the National School Reform Faculty Research Forum January, The Pennsylvania State University.
- Eyler and Giles, (2002) Reflection: Linking Service and Learning—Linking Students and Communities - Vanderbilt University, Journal of Social Issues, Vol. 58, No. 3, , pp. 517--534
- John T. E. Richardson, (2005) Educational Psychology, Vol. 25, No. 6, December, pp. 673–680 ISSN 0144-3410 (print)/ISSN 1469-5820 (online)/05/060673–08 © 2005 .
- Kelly A. Rocca, (2010) Student Participation in the College Classroom: An Extended Multidisciplinary Literature Review, Communication Education 59(2):185-213 · April 2010
- Lisa G. Bullard and Richard M. Felder, (2007) A Student-Centered Approach To Teaching Material And Energy Balances, Chem. Engr. Education, Vol. 41, No.3..
- MICHAEL PRINCE, (2004) Does Active Learning Work? A Review of the Research, Journal of Engineering Education 1. . Department of Chemical Engineering. Bucknell University.
- Michael Prince and Richard Felder, (2007) The Many Faces of Inductive Teaching and Learning, Journal of College Science Teaching, National Science Teachers Association (NSTA). Reprinted with permission from Journal of College Science Teaching, Vol. 36, No. 5, March/April 2007.
- Ramsden, P, (1979) Student learning and perceptions of the academic environment. Higher Education, 8, 411–427.
- Ramsden, P., A performance indicator of teaching quality in higher education: The Course Experience Questionnaire. Studies in Higher Education, 16, 129–150
- Richardson, J. T. E., (1991) Student learning in higher education, Educational Psychology, 3, 305–331. 1983.
- Richardson, J. T. E., (2000) Researching student learning: Approaches to studying in campus-based and distance education. Buckingham, UK: SRHE and Open University Press.
- Richardson, J. T. E. (2005) students’ perceptions of academic quality and approaches to studying in distance education, British Educational Research Journal, 31, 7–27.
- Richard M. Felder. Rebecca Brent. (2001) Cooperation & Collaboration in College Teaching, North Carolina State University. *J. 10(2), 69–75
- Ryan, J., & Harrison, P. (1995). The relationship between individual instructional characteristics and the overall assessment of teaching effectiveness across different instructional contexts. Research in Higher Education, 36(5), 5774.-59
- Richard M. Felder, and Rebecca Brent, (2007) Cooperative Learning, Department of Chemical Engineering, N.C. State University.
- Taylor & Francis, Students’ Approaches to Learning and Teachers’ Approaches to Teaching in Higher Education The Open University, UK
- Trigwell, K., & Prosser, M. (1996) Changing approaches to teaching: A relational perspective. Studies in Higher Education, 21, 275–284.
- Trigwell, K., Prosser, M., & Waterhouse, F., (1996) Relations between teachers’ approaches to teaching and students’ approaches to learning. Higher Education, 37, 57–70.
- Hung et al., (2003). Understanding That Can Be Achieved Over a Short Term University of North Dakota.
- Dr. Sangeetha Natarajan *